Grafana is an open source software that specializes in creating graphs and visualizations for users to easily understand the time-series data.
On this step-by-step guide, we will be launching an EC2 Instance with Amazon Linux 2 as the operating system, then install and run Grafana.
EC2 Instance Setup
Launch an EC2 Instance using the Amazon Linux 2 AMI.
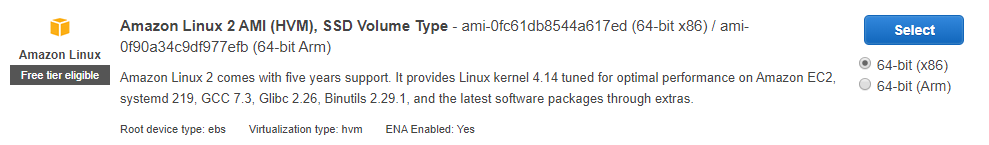
For reference here are the settings of my EC2 Instance.
| AMI | Amazon Linux 2 |
| Instance Type | t2.micro (free tier) or t3a.nano (cheapest) |
| Storage | 8GB General Purpose SSD (gp2) |
| Tags | Key: Name Value: Grafana-Server |
| Security Group | See below (EC2 Security Group Setup) |
Note: This post is about installing Grafana on Amazon Linux 2. Launching an EC2 Instance will not be discussed here.
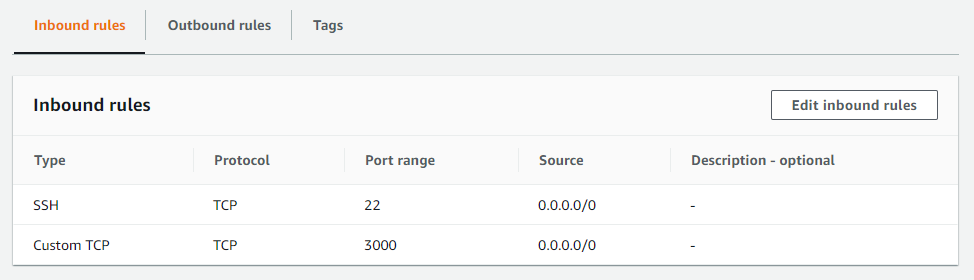
EC2 Security Group Setup
For the EC2 Instance Security Group I opened SSH (22) and default Grafana port (3000) to the internet (0.0.0.0/0).
Grafana Installation
SSH to the target EC2 Instance.
ssh ec2-user@18.206.59.38 -i GrafanaKeyPair.pemSince this is the first time we are using the EC2 Instance we need to update all installed packages.
sudo yum update -yThen we add a new YUM respository for the operating system to know where to download Grafana. The command below will use nano.
sudo nano /etc/yum.repos.d/grafana.repoAdd the lines below to grafana.repo. This setting will install to the Open Source version of Grafana.
[grafana]
name=grafana
baseurl=https://packages.grafana.com/oss/rpm
repo_gpgcheck=1
enabled=1
gpgcheck=1
gpgkey=https://packages.grafana.com/gpg.key
sslverify=1
sslcacert=/etc/pki/tls/certs/ca-bundle.crt
Install Grafana.
sudo yum install grafanaThere will be around 3 times the system will ask if it is okay to download the grafana packages. Just press Y and enter everytime to allow download and installation.
Reload the systemd to load the new settings. Start Grafana Server, then check for its status.
sudo systemctl daemon-reloadStart the Grafana Server.
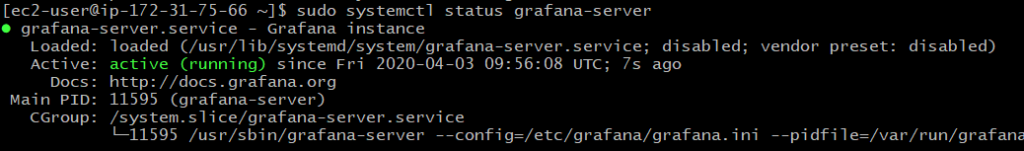
sudo systemctl start grafana-serverCheck the status of Grafana Server
sudo systemctl status grafana-serverStatus output should show that grafana-server is active (running).
Run the command below to make sure that Grafana will start upon booting our Amazon Linux 2 instance.
sudo systemctl enable grafana-server.serviceTesting Grafana
Visit the newly installed Grafana Server by visiting the Public IP of the EC2 Instance on port 3000.
18.206.59.38:3000This will then redirect to the login screen of Grafana.
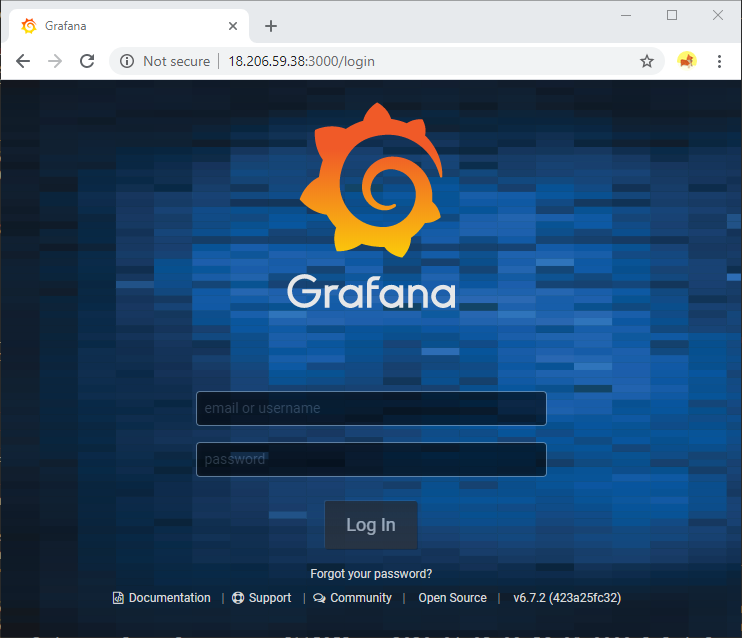
See default username and password below.
| Username | admin |
| Password | admin |
On first login Grafana will requires to change the admin password. Input the desired password (except admin) and click Save.

This will move to the default Grafana Welcome Grafana page.
We can now add Data Sources, Dashboards, Users or Explore plugins and many more.

We have now succesfully installed Grafana on EC2 Instance running in Amazon Linux 2.
If you have any questions or issues encountered let me know in the comments below.
Bonjour ! Très bon article, même si il y aurais quelques petits points à rajouter, l’article reste super intéressant.